

Splines: Precision in livestock data modeling
Animal performance analysis has advanced significantly with the rise of real-time monitoring technologies. In modern livestock systems—especially those within the scope of precision livestock farming—generating accurate data on growth and productive efficiency is essential. Within this context, there is a growing need for robust and flexible statistical tools to correctly interpret data trends. One of the most promising mathematical approaches for this purpose is the use of spline functions, which can accurately fit curves to complex biological data.
What are Splines?
Splines are segmented polynomial functions connected smoothly at specific points called knots. These knots mark transitions between different polynomial sections, yet the resulting curve remains continuous and smooth. This characteristic is essential for representing biological processes. Unlike linear models, which try to impose a single structure across the entire dataset, splines adapt to the data’s actual behavior, respecting not just the mean value of a point, but also its tendencies—such as acceleration or deceleration.
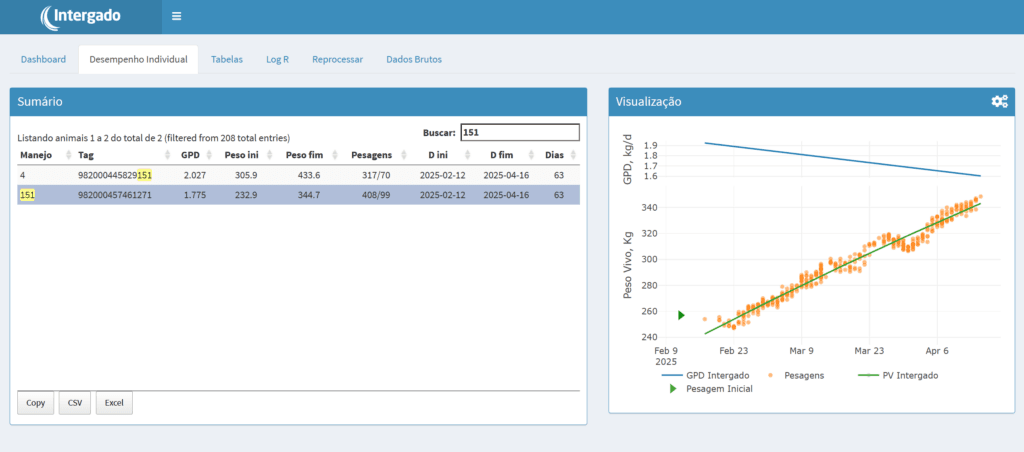
Graph 1 – Animal weight gain using a linear model
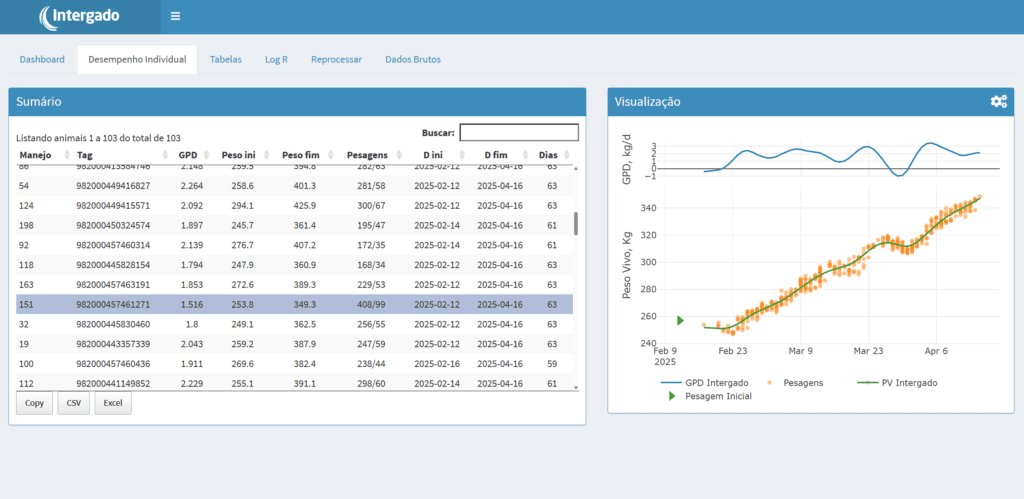
Graph 2 – Animal weight gain using spline modeling
Why use splines in precision livestock farming?
In livestock production, it’s common to analyze variables that change over time, such as:
- Body weight
- Feed conversion efficiency
- Responses to nutritional or health management
These metrics rarely follow linear patterns. There are inflection points—moments when behavior shifts. Forcing a straight or single curve onto such processes can hide valuable information. Splines allow curves to reflect these nuances, offering a more accurate picture of the animal’s real performance.
Statistical and computational considerations
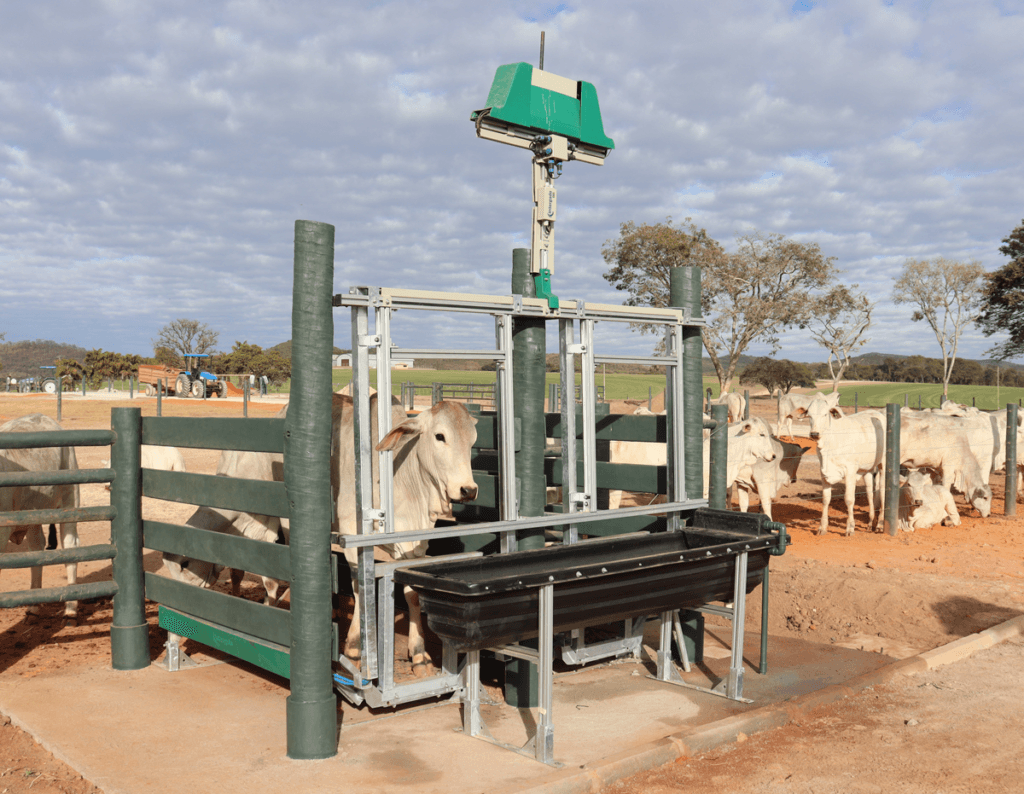
From a statistical perspective, applying splines requires a sufficient number of data points. Voluntary weighing systems, such as the automatic scales that record weight each time the animal visits the water source, are ideal for unlocking the full potential of spline modeling.
Fortunately, platforms like R, Python, SAS, and Desempenho Intergado—Ponta’s exclusive performance-tracking app—already integrate spline functions, making the technique more accessible.
Splines in practice
In the context of precision livestock farming, spline modeling is already embedded in tools like Desempenho Intergado, enabling users to monitor animal performance through dynamic, adaptive charts. This more precise modeling empowers producers, technicians, and consultants to:
- Detect performance deviations earlier
- Objectively evaluate the impact of management changes
- Communicate results with greater clarity and technical support
How to use Splines in Desempenho Intergado
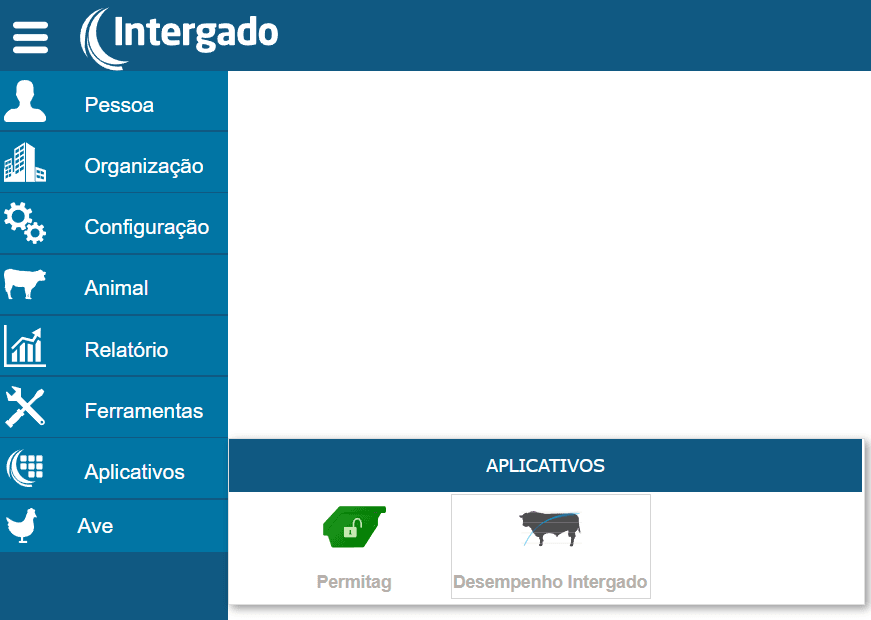
Step 1: Log into your Intergado System account and access the Desempenho Intergado app.
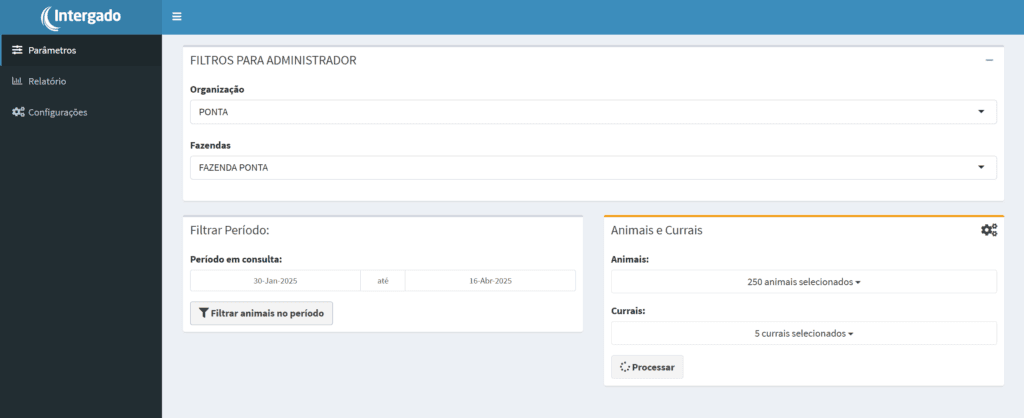
Step 2: In the “Parameters” tab, select the farm, time period, and pens you wish to view.
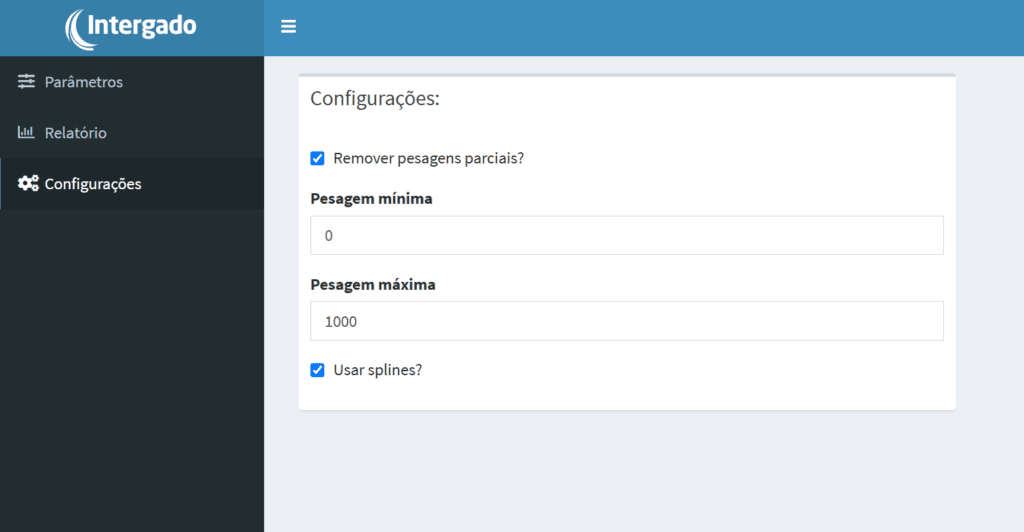
Step 3: In the “Settings” tab, enable the “Use splines” option.
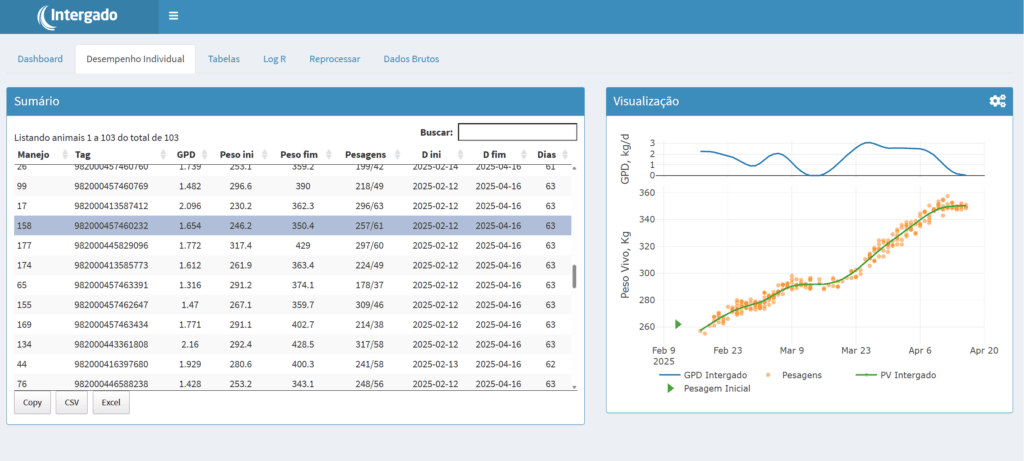
Step 4: Done! Your individual performance chart will now reflect spline modeling.
Conclusion: A powerful tool for data-driven decisions
Using splines represents a methodological advancement in livestock data analysis. Their ability to model nonlinear and complex phenomena provides deeper insights into animal performance—ultimately contributing to better decision-making in the field. In an environment of increasing data volume and detail, incorporating tools like splines is not just beneficial—it’s essential for turning information into productive, actionable results.
Article originally written by Giovanna Moraes, Head of the Genetics Market, and Paulo Victor Mariano, Supervisor of Precision Livestock Services, both at Ponta.